
Continuing the series on how to quote, forecast and measure recurring revenue...
What I'm trying to determine with Quotes are the:
What I'm trying to determine with Quotes are the:
- Number of payments
- Amount of each recurring payment, and
- Amount of the initial payment
I'm basing these on custom fields on the Opportunity (Term, the service duration in months) and Product (Category).
In practice, I also have the Term on the Quote object so that we can have quotes for different terms attached to a single opportunity. Then I use Custom Quote Sync from Salesforce Labs to sync custom fields across the Quote and Opportunity. But that's a detail I'll avoid for now.I have two fields to add to the Quote Line Item (QLI):
- Recurring Charges: If the Line Item's Product Category (see the prior post) is either Subscription or Over Time, the Recurring Charges are set to the Line Item's Total Price; otherwise to 0. BUT... this is NOT a formula field. Instead, I populate it via a simple workflow rule and field update. Why? Because I want a rollup field on the Quote object, and the rollup cannot aggregate a formula field! I'll make this field read-only except for Admins.
- TMService Charges: This is just like Recurring Charges, but is 0 unless the Product Category is Over Time. I use the same workflow rule to update both fields (firing any time the QLI is created or edited), though obviously they have their own field updates.
- Payment Count: numeric formula field. If the Opportunity Term is less than 24, the payment count is 1. Otherwise, it's the floor of (Term / 12). (You might choose to calculate this differently so that, for instance, an 18-month deal has a six-month payment upfront and then a 12-month payment later. I'm planning to bill the first year-and-a-fraction upfront.)
- Recurring Charges: this is rollup summary, totaling the QLI Recurring Charges.
- TMService Charges: another rollup summary, totaling the QLI TMService Charges.
- Payment N: currency formula field. For deals of two years or longer, this is the charge for 12 months of service. If the Payment Count is 1, then this is 0. Otherwise, it's 12 * ((Recurring Charges - TMService Charges)/ Term).
- Payment 1: currency formula field. This is just the quote's Total Price, less the charges for services delivered over time, less the amounts that will be billed on subsequent payments. So the formula is Total Price - TMService Charges - (Payment N) * (Payment Count - 1). This excludes any shipping or tax items that are part of the quote's Grand Total but not part of the Total Price; the expectation is that those would be itemized separately.
That gives me everything I need to include payment info on the quote.
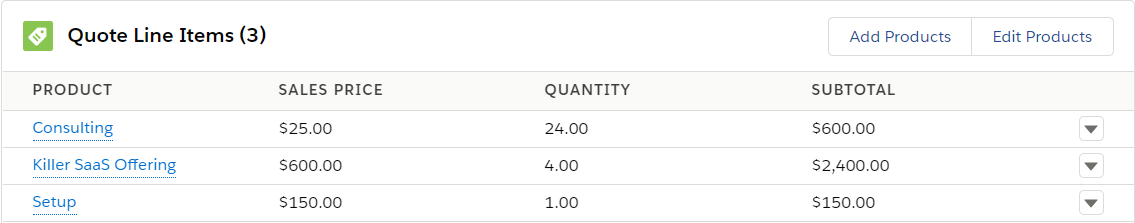
Let's see how this looks in practice. I'm going to create a 24-month quote, with three line items: $2400 (total price) for a Subscription charge, $150 One Time, and $600 Over Time. First, we see the line items that comprise the quote:

Then, in the quote detail record, we can see how those translated into values for our custom fields:

The Recurring Charges, $3000, are the sum of the SaaS Offering and the Consulting totals. The TMService Charges are just the Consulting charges. We calculated two payments based on the 24-month term. The first payment covers the setup charges ($150) plus 12 months of the subscription (12 * $2400 / 24). The second payment is just for the next 12 months' subscription. Note that the TMService Charges aren't included in either Payment 1 or Payment N; those will be billed as services are performed.
Next time, we'll make similar updates on the Opportunity and Opportunity Product objects.
Let's see how this looks in practice. I'm going to create a 24-month quote, with three line items: $2400 (total price) for a Subscription charge, $150 One Time, and $600 Over Time. First, we see the line items that comprise the quote:
Then, in the quote detail record, we can see how those translated into values for our custom fields:

The Recurring Charges, $3000, are the sum of the SaaS Offering and the Consulting totals. The TMService Charges are just the Consulting charges. We calculated two payments based on the 24-month term. The first payment covers the setup charges ($150) plus 12 months of the subscription (12 * $2400 / 24). The second payment is just for the next 12 months' subscription. Note that the TMService Charges aren't included in either Payment 1 or Payment N; those will be billed as services are performed.
Next time, we'll make similar updates on the Opportunity and Opportunity Product objects.
Comments
Post a Comment